As an avid biker and CitiBiker, it became obvious to me in recent years that bike and dock availability has substantially declined in the last few years. Whereas previously single docks would be completely full or empty, now entire neighborhoods became unridable. I especially felt this one day, as I arrived at work (in the Financial District) about 10 minutes before my first meeting of the day, only to find that the next available dock was in Chinatown, a 15 minute ride and 30 minute walk back to the office. Other people, that I met in person as well as saw on Reddit, corroborated this sentiment.
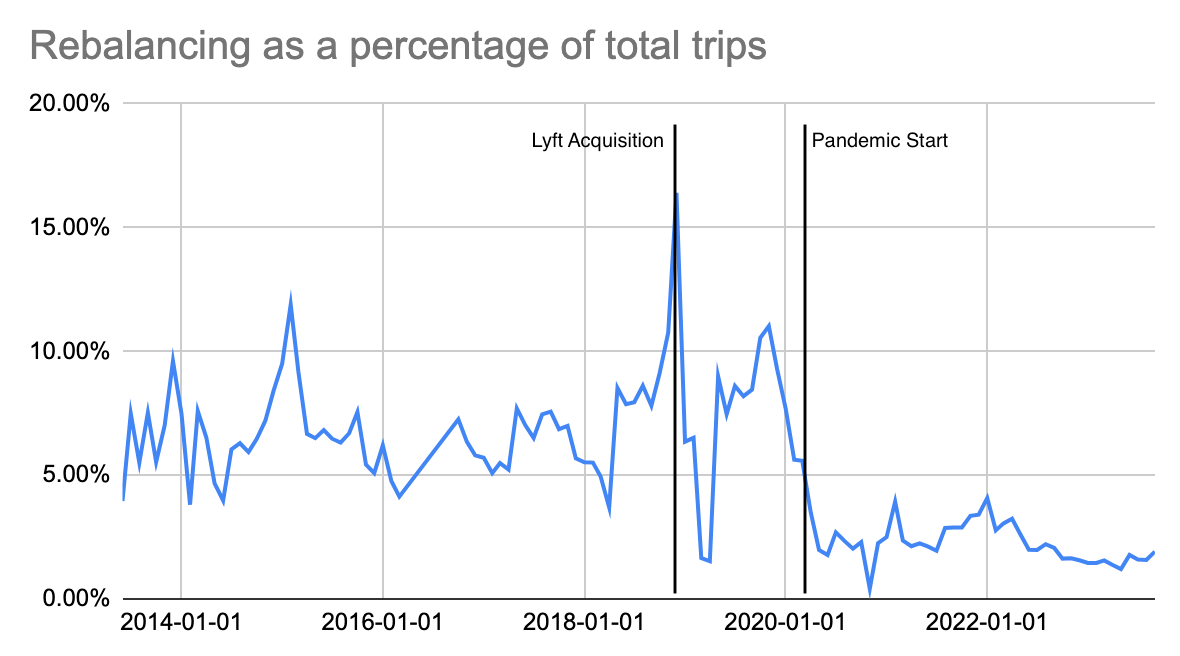
I decided to analyze the data to see if, and how much, Citibike had actually declined in rebalancing. For this, I used the monthly operating reports that Lyft makes available to the DOT and general public. The resulting graph was looked like this
The data is very clear: while there was no immediate change in the year following the Lyft acquisition of Motivate, the start of the pandemic coincided with an 80% drop in rebalancing activities, as a percentage of total trips taken. Whereas Lyft used to rebalance about 7-8 bikes per 100 trips, that number has dropped to about 1.5 and not recovered.
This chart, showing monthly totals, is another striking view of how system usage grew steadily during the pandemic, but rebalancing actually declined in absolute numbers.
Scooped by the Comptroller
As I was finalizing this data and preparing to write it up, the NYC Comptroller’s office published the same data in a much more comprehensive format. They included a critical statistic that I had been looking for but could not find: dock availability, which they obtained by writing a scraper of the live data feed, running every 15 minutes over the course of 2 summer months, to create a very clear map of the issue. While it would have been nice to publish my data first, I am thankful that the Comptroller’s office took on this assignment, because of the comprehensiveness and visibility that the report provides.
Some other thoughts on that report, having worked on this as well:
It was interesting that they noted issues with the uptime of the real-time data feed
They don’t appear to have access to any non-public information, except potentially the terms of the contract between the DOT and Lyft. I am glad to see they were willing to write scrapers and collect data; on the other hand, it would be nice to know if the city is actually collecting the fines they are entitled to.
On that note, it’s bizarre to me that the monthly reports Lyft publishes don’t specify whether they are meeting all terms of their contract (specifically the dock availability one). Perhaps the report format was decided in the original contract but not updated after adding more terms?
The report’s map shows generally good availability in Manhattan below 14th St. That is my primary ridership area and I have not found that to be the case, so I can only imagine that the outer borough experience must be especially bad.
I’ve also observed ebbs and flows of availability in this area, perhaps due to differing rebalancing priorities by week or month. I would encourage the Comptroller’s office, if they are not doing so already, to continue collecting data for a full year.
I’m curious how the report authors handled bad data published by Lyft (see below for example)
Notes on Methodology
I put the raw data I compiled on Google Sheets.
Some monthly reports were not available on Lyft’s website during my research period. Luckily, I managed to download all while they were still available. They generally appear to be back online.
Reports appear to be divided between two different AWS S3 buckets, and one Cloudfront distribution (which often just acts as a cache in front of S3), so permissions issues may have arisen with some of these.
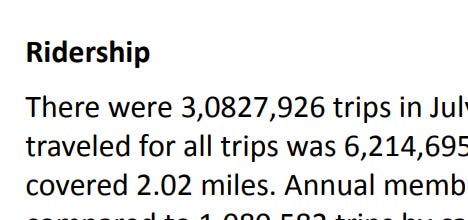
At least one report included invalid numbers, like the July 2021 one that still reports this ridership number as of time of writing this post:
In this case, I removed the 0 to make it 3,827,926, but that was just a best guess.
I converted the PDFs to text files and then extracted the numbers I needed using regular expressions. Due to changes over time in the report format, those regexes ended up looking as follows:
rebalancing = ".*\w+\sstaff\srebalanced.{0,30}\s([\d,]+)\s?bicycles\s.*"
trips = "There\swere\s([\d,]+)\strips"
Conclusion
I was glad to learn, in the Comptroller’s report, that the city contract already includes dock availability terms. I am slightly concerned that the incentives are a bit misaligned: if Lyft were to install twice the density of docks (which would be great for riders), they would also be liable for twice the amount of fines. A neighborhood- or region-based model might make more sense to avoid this misaligned incentive. This also extends to bike availability, which stipulates fines based on percentage of bikes available, rather than a fixed minimum number.
Higher level, I am glad to see the Comptroller’s office engaged in this issue, and hope that the DOT takes note and holds Lyft accountable to providing good service. At the same time, as many people have previously noted as well, the city provides no subsidies for this invaluable public utility, so any requests by Lyft to that effect should be seriously considered.


great post
Have you seen the crews moving bikes between two stations to game the prices? I'm wondering if this has increased the deliveries without improving the network.
-dean foster